Phoebe COVID-19 Statistics
Last Updated: 6/2/2023
 We continue to monitor both the community infection rate and vaccination rate and adjust our visitation guidelines as needed. For the latest visitation guidelines, please click here. For the latest COVID-19 updates or to schedule a vaccination appointment, click here.
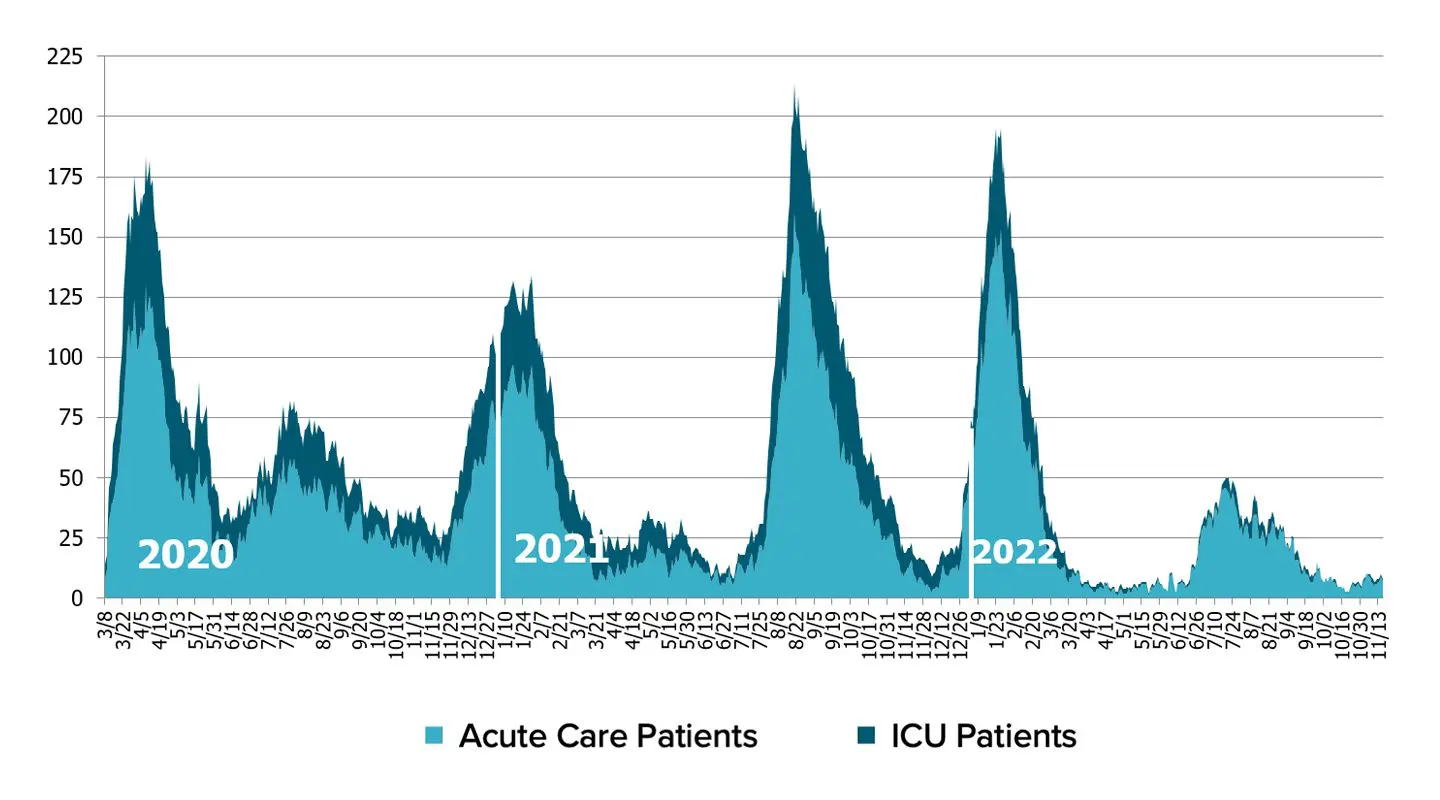
COVID-19 Inpatient Health System Trends
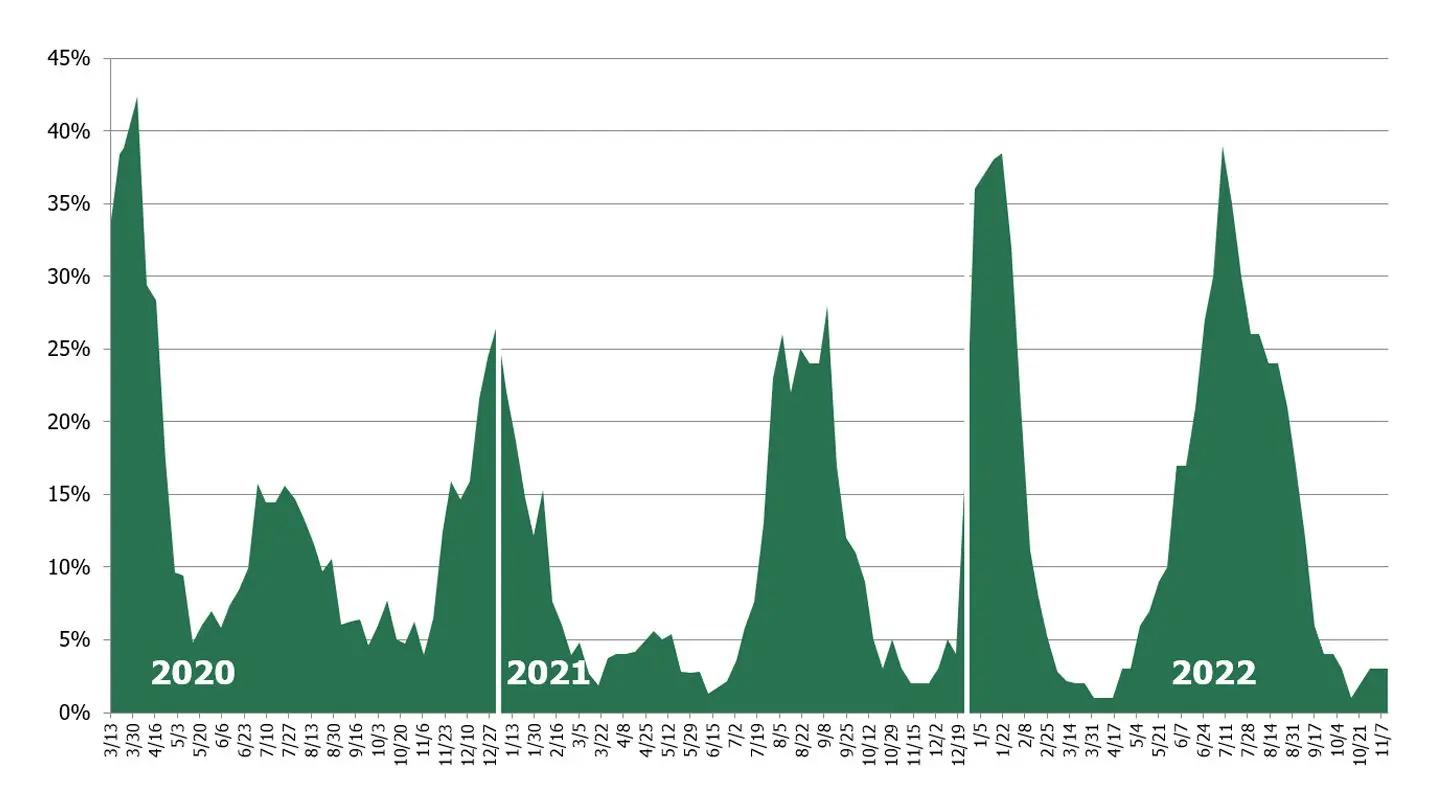
COVID-19 Outpatient Positivity Rate
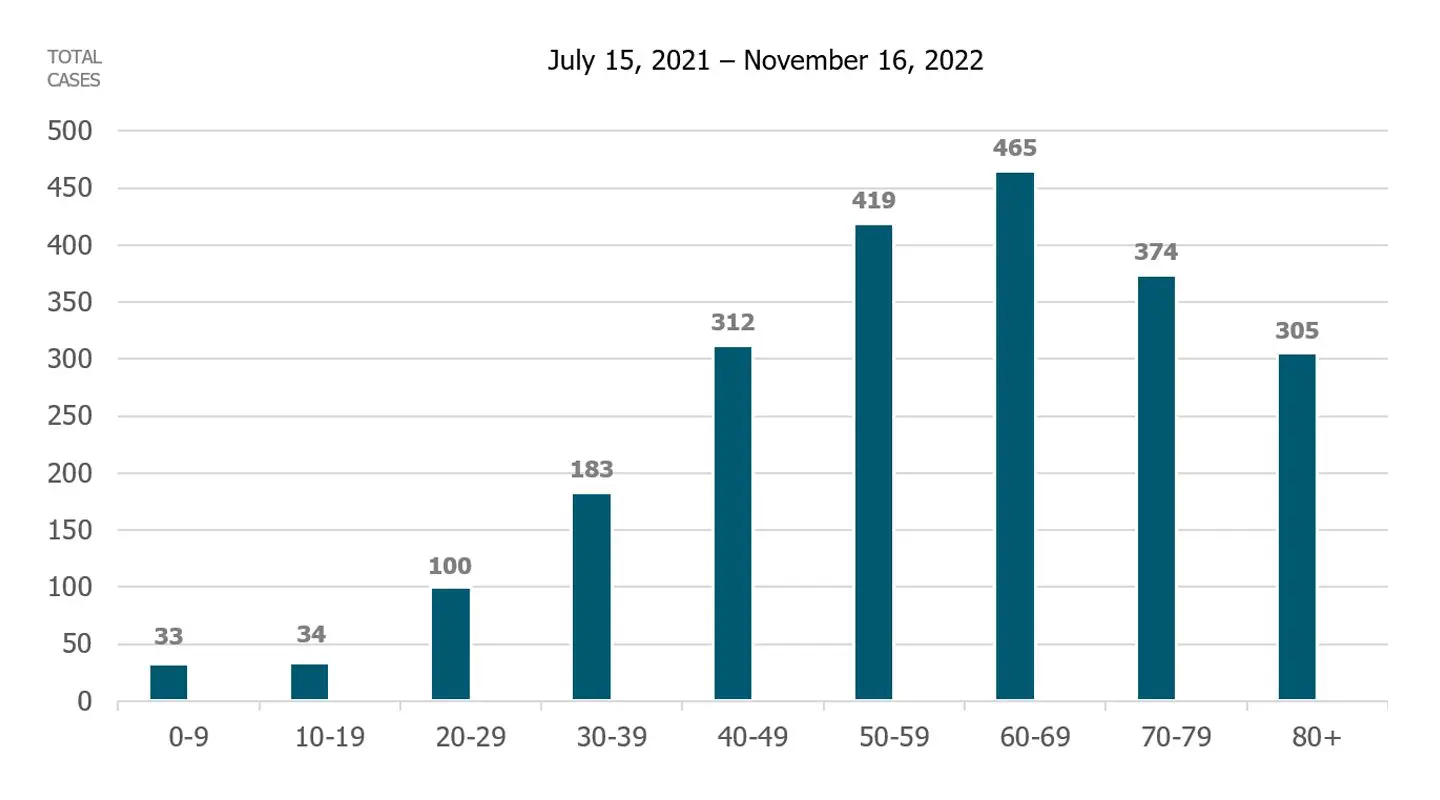
Inpatient Age Group
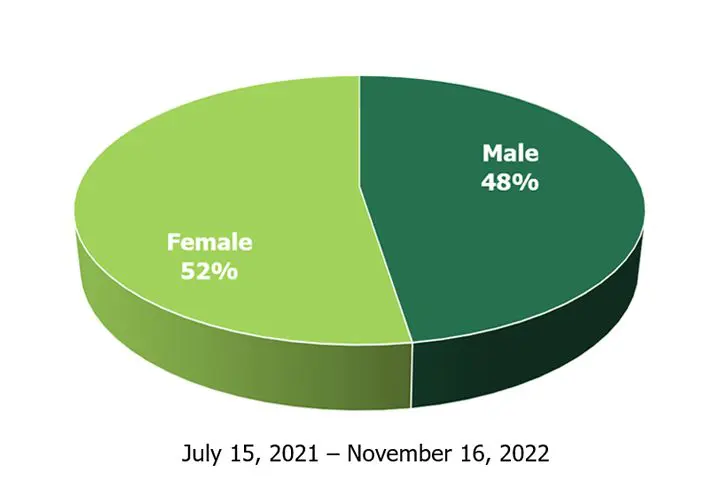
Inpatient Gender
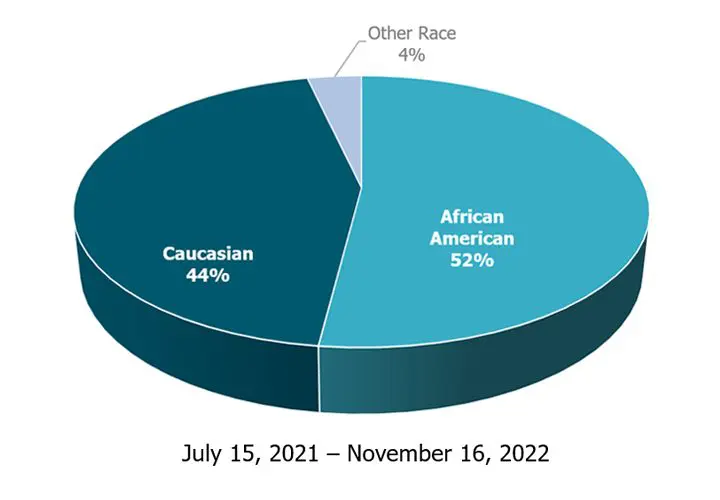
Inpatient Ethnicity
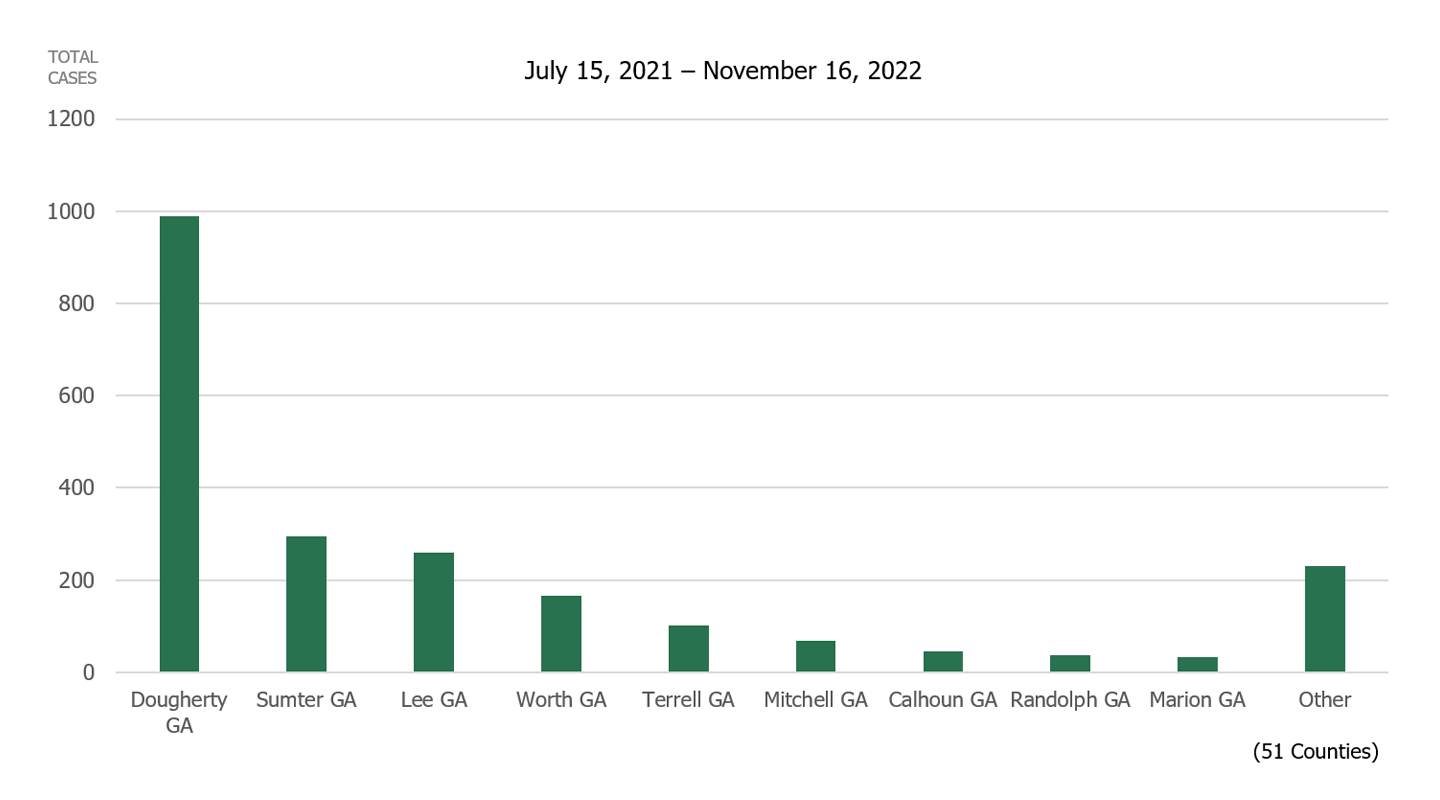
Inpatient County of Residence
Percentage of Positive COVID-19 Tests
The Georgia Department of Public Health shares comprehensive COVID-19 testing data daily, including the rolling 7-day average of the percentage of COVID-19 tests that yield positive results. The percentages change daily and can be narrowed to the county of residence for a more localized view of virus spread.
Community Vaccines Administered
The Georgia Department of Public Health shares comprehensive COVID-19 vaccination data daily, including data by county. To view this data, please click the button below and use the “Filter Data by County” option in the top right of the page.
